Power BI Publisher for Excel

Publish Excel to Power BI

Update: Publish your Excel (M365) reports to Power BI Service

The Excel Pulisher to Power BI Service is not available as an add-in anymore. It is now a built-in feature within the Excel app itself.

You can now publish your Excel reports directly from the Excel itself into your Power BI Service. Follow the steps below:

1- Click File menu then click Publish
2- Click Publish to Power BI
3- Select a Workspace you’d like to publish the report from the dropdown
4- Click Upload
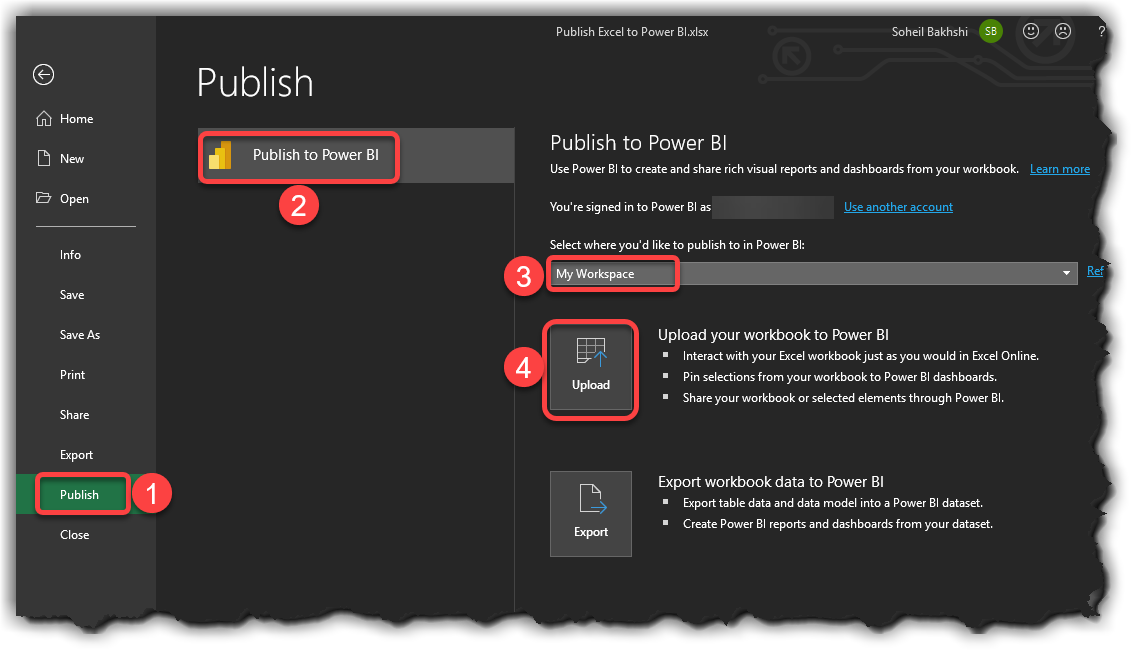
Publishing Excel reports to Power BI Service

After the report successfully published to your Power BI Service, a yellow message shows up in Excel. You can click the Go to Power BI button.
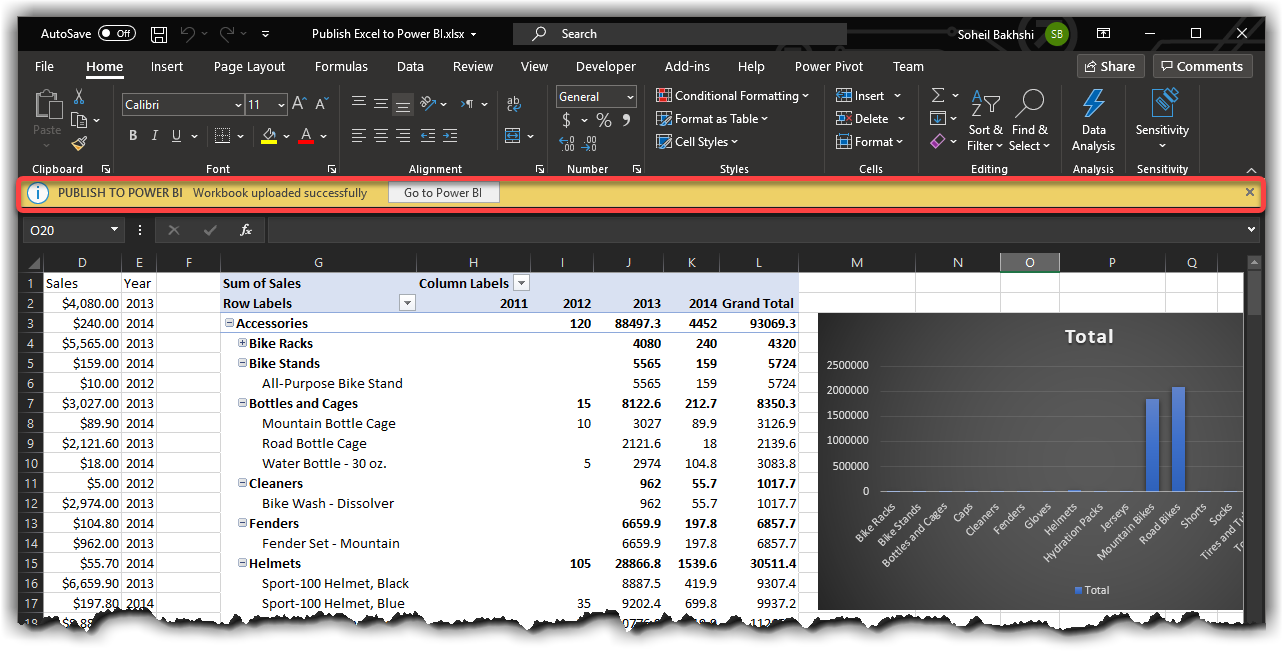
Go to Power BI after Publishing Excel reports to Power BI from Excel

5- From your Power BI Service, click to open the published Excel report in Power BI Service
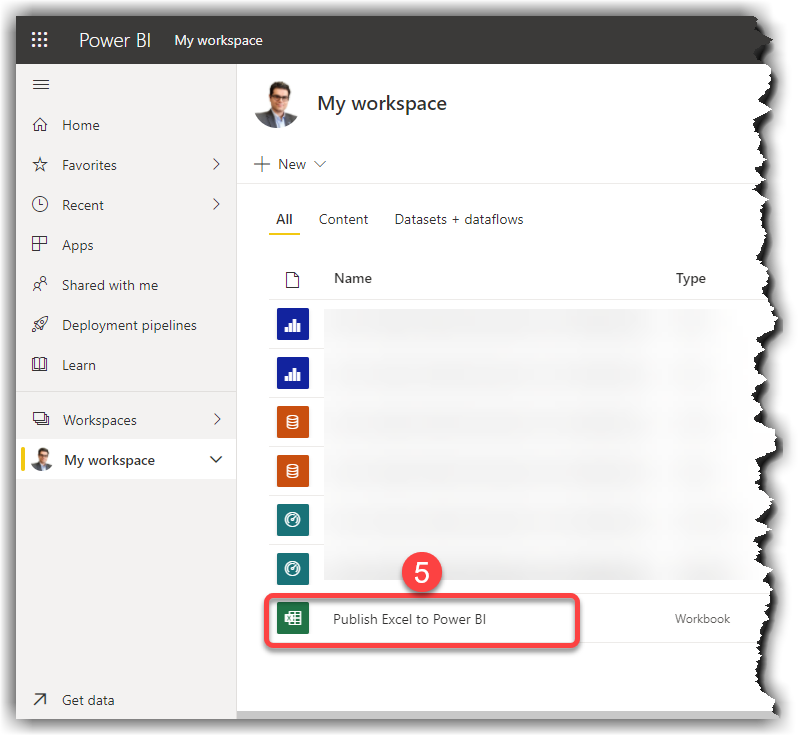
Opening a Published Excel report in Power BI Service

6- Select a chart
7- Click Pin
8- Select an Existing dashboard or New dashboard
9- Click Pin
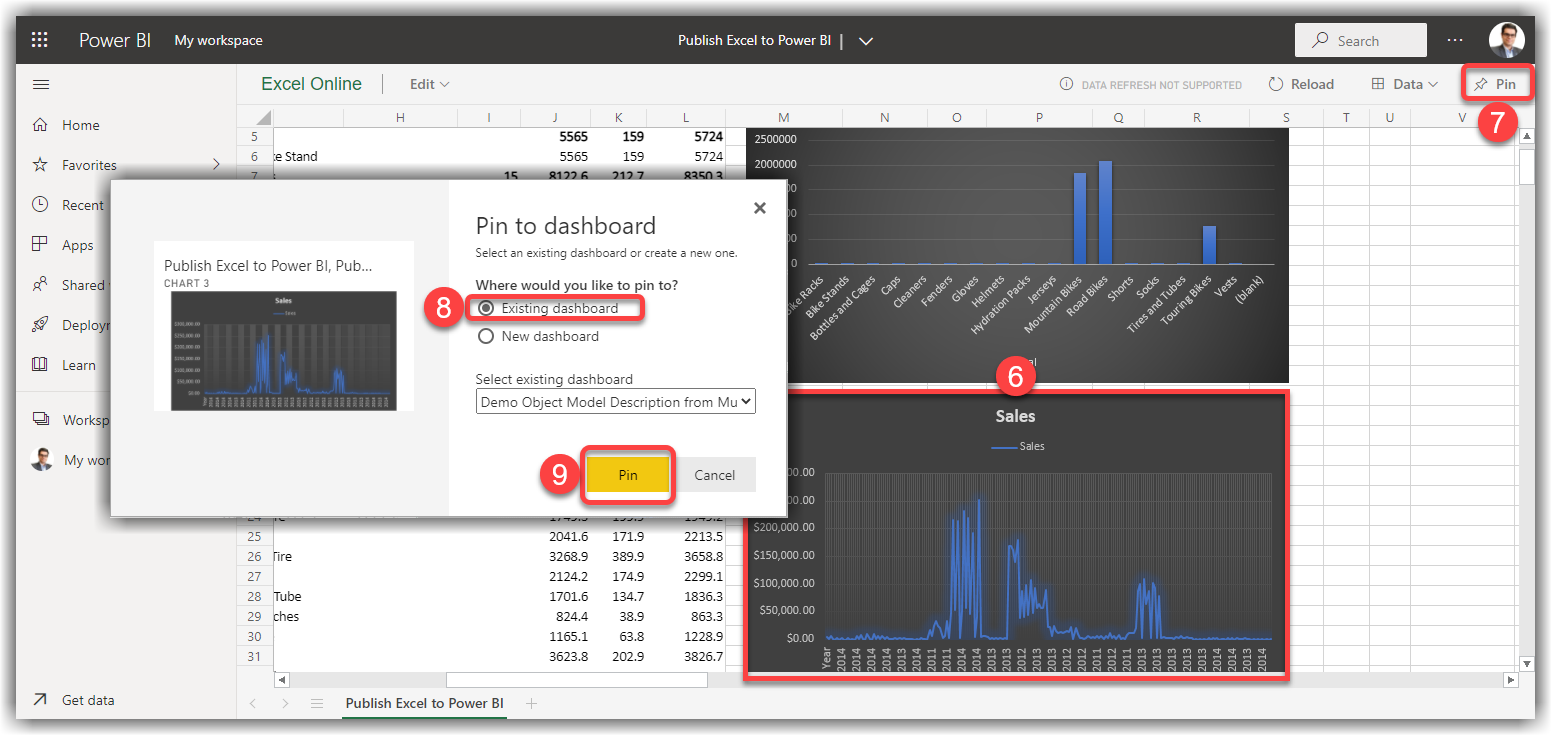
Pinning a chart from an Excel report to Power BI Dashboard

All Done! If you navigate to your Power BI Dashboard, the pinned charts must appear on the dashboard.
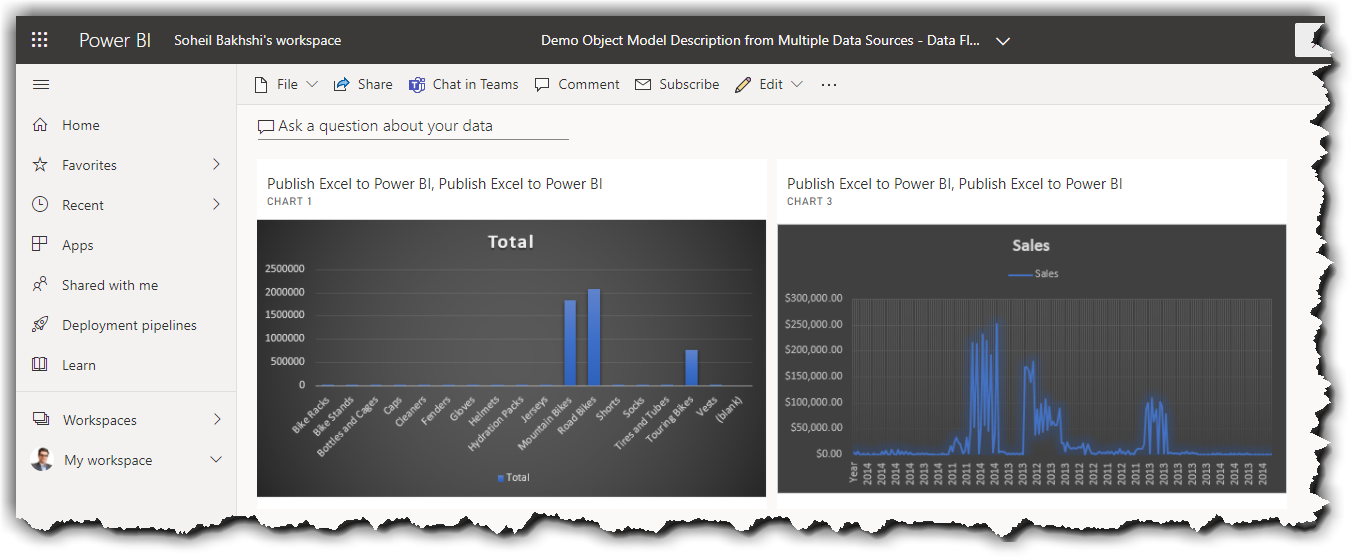
Pinned charts in Power BI DashboardIf you’re using the older versions of Excel then continue reading.

It’s been awhile that lots of Excel users were wondering if there is a way to include their Excel elements into Power BI dashboards. With Power BI Publisher for Excel you’re now able to publish snapshots on your important PivotTables, Charts, cell ranges etc. to your Power BI Dashboards. In this post you’ll learn how to get the job done.

How does Power BI Publisher for Excel works?

With the Power BI Publisher Excel you take snapshots of your important insights in Excel and Pin them in Power BI Dashboards.

You need to download and install the Power BI Publisher for Excel from here.

What Excel elements you can/cannot pin?

You can pin almost everything in your Excel worksheet including:

  • A range of cells (from a simple sheet, from a table or a pivot table)
  • Pivot charts
  • Illustrations and images
  • Text

However, you cannot pin 3D Maps or visualisations from Power View.

Note: Although you can pin almost everything from your worksheet to a Power BI Dashboard it doesn’t make sense to pin some elements like Slicers or Timeline filters.

Enabling Power BI Publisher for Excel

The Power BI Publisher for Excel add-in should be enabled by default, however, if for some reason it is not enabled you can manually enable it as below:

Power BI Publisher for Excel 01
Continue reading “Power BI Publisher for Excel”

Power BI and iFrame

Power BI is growing very quickly and there are tons of fantastic features added to it during the past few months. So there are lots of Power BI subjects we can talk about these days. In this article I want to represent a new feature added to Power BI Service which is “Publish to Web”. Publish to Web is basically putting Power BI reports in an iFrame. So now we can combine Power BI and iFrame  together and embed Power BI reports into a web page to share data insights to the Internet. Keep in mind that the data we publish to web will be available to anyone on the Internet. So we really need to make sure we do NOT share any confidential information and we have the rights to share that information.

Note: Publish to web feature is in Preview  so it is available for all users with no costs during the preview. So you don’t need to have a Pro account to be able to use this feature for now.

I also explain how to embed a rich media content in your Power BI Dashboard.

Note:  Publish to web and embedding a rich media content to your dashboard are different features available in Power BI Service.

Power BI Publish to Web

Publishing a Power BI report to web not only creates a link that you can send in email, but also creates HTML iFrame you can put in your blog or website. I would like to remind you again that the “Publish to Web” feature is only available in Power BI Service so don’t get confused by looking for such a feature in Power BI Desktop.

Enabling Power BI Publish to Web

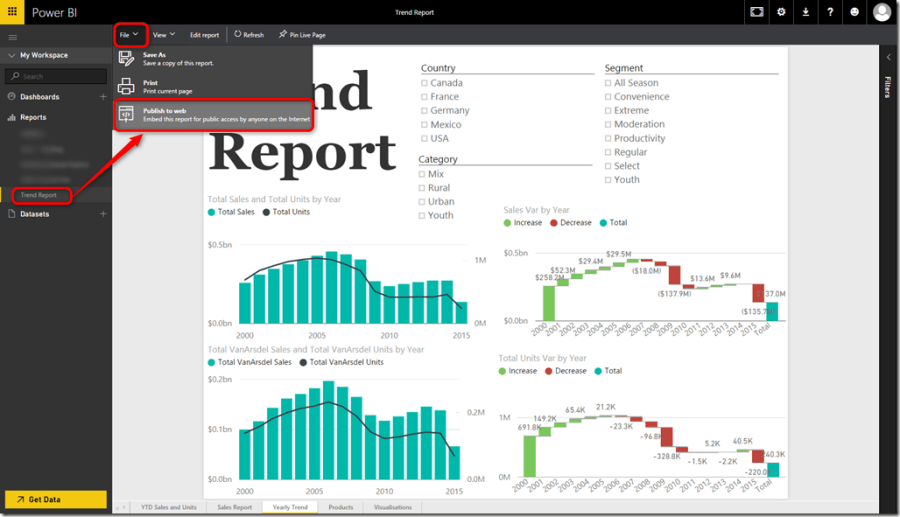
To enable Power BI Publish to Web follow the steps below:

  • Login to your Power BI Service
  • Open a desired report
  • Click “File” menu then “Publish to Web”

Power BI and iFrame

Continue reading “Power BI and iFrame”

Webinar Materials: Visualising Azure SQL DW with Power BI

Power BI Azure SQL DW PassIn the previous post I announced that I will speak in “Visualising Your Azure SQL Data Warehouse with Power BI” webinar on 23 Jan 2016. The webinar host was Pass Business Intelligence Virtual Chapter. It was such an amazing experience for me to speak in the webinar and I would like to thank all 105 attendees. The attendees showed their enthusiasm by asking lots of questions during the webinar.

In this webinar I demonstrated:

  • How to install Azure SQL DW in Azure Portal
  • How to configure firewall settings from Azure Portal and SQL Server Management Studio (SSMS) 2016
  • How to connect directly from Azure SQL DW to Power BI Service and the other way around
  • How to visualise you Azure SQL DW data warehouse data with Power BI Desktop (both Data Import and DirectQuery scenarios)
  • Comparing the features of different scenarios that helps you finding the best for your use cases

and much more…

You can see and download the session materials as follows.

Session Materials

Watch Visualising Your Azure SQL Data Warehouse with Power BI on YouTube

Continue reading “Webinar Materials: Visualising Azure SQL DW with Power BI”

Power BI Enterprise Gateway, Everything You Need to Know

On-premises Data Gateway (aka Power BI Enterprise Gateway) is release a while ago (2 Dec. 2015), but, with the latest release on 22 Dec. 2015 Power BI Enterprise Gateway now supports live connections to both SQL Server Analysis Services Multidimensional and Tabular models as well as SAP HANA. In this post I’ll explain lots of important aspects of the Power BI Enterprise Gateway including installation,  configuration for different data sources including SSAS Multidimensional, Tabular and SQL Server Database and much more. If you need to have the lowest possible latency then you need DirectQuery/Explore Live feature on top of your on-premises data sources. The good news is that Power BI Enterprise Gateway now supports all following data sources:

  • SQL Server Database
  • SQL Server Analysis Services Multidimensional
  • SQL Server Analysis Services Tabular
  • SAP HANA

    In this article you’ll learn how to install and configure Power BI Enterprise Gate Way, how to manage different live data sources, how to create reports on top of live data sources and more.

  • Note 1: If you want to use DirectQuery to connect to your on-prem SQL Server Database OR Explore Live your SQL Server Analysis Services Tabular model then you might not need to install and use the Power BI Enterprise Gateway. In those cases you can install Power BI Personal Gateway to connect to an instance of SQL Server OR install Power BI Analysis Services Connector to connect to your on-prem instance of SQL Server Analysis Services Tabular model rather than installing the Power BI Enterprise Gateway. But, bear in mind that selecting the best gateway is really depending on your use cases, your data sources and the environment you’re working on.

  • Note 2: The Power BI Enterprise Gateway and Power BI Personal Gateway CAN be installed on the same machine.

    Downloading and Installing Power BI Enterprise Gateway

    You can download the gateway from the dedicated download page for On-premises Data Gateway on Microsoft website or after logging into Power BI Service with your account, click on “Data  Gateway” from the download menu:
    downloading on-premises data gateway from Power BI service

    OR you can go straight to the gateway page then download the Power BI Gateway – Enterprise (Preview):

    Direct Link to Download Power BI Enterprise Gateway

Continue reading “Power BI Enterprise Gateway, Everything You Need to Know”